Overview
As you may know, .NET provides nice Data Visualization features.
But, .NET Data Visualization only supports RGB raster image charts(.png, .jpg, etc) and creating high-resolution images takes much time. Also, does not supoort PDF and PostScript outputs for volume printing.
- Why PDF and PostScript outputs
- The size of PDF/PostScript charts in high-resolution output is normally 10kb ~ 50kb per chart, but the size of raster image charts(.png, .jpg, .tif formats) may have 1mb ~ 5mb size.
- Much faster creation, comparing to bitmap charts.
- Let’s assume we create a chart with 2x2-inch (600 dpi resultion). Drawing raster chart image needs to handle 1,200x1,200=1,440,000 pixels and each pixel contains 3 or 4 bytes of memory, this will cause slow and huge outputs. But, for vector outputs like PDF/PostScript, drawing lines/circles/stroke/fill commands just need few bytes and creating rasterized images that requires much computing power and memory will be done by PDF viewers(like Adobe Acrobat PDF Reader) or printers.
- PostScript and PDF also support CMYK, printing color images requires CMYK color-space for precise colors.
- PDF, PostScript Chart Features
- Support CMYK color-space
- 100% vector graphics
- Fonts and reusable objects(images) are not duplicated in PDF and PostScript output
- iTextSharp(PDF) and custom PostScript libraries are used
- Features above result faster speed and smaller outputs
-
Source code for .NET 8 Data Visualization with PDF and PostScript
-
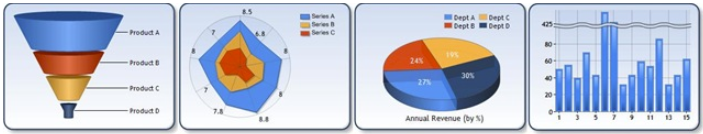
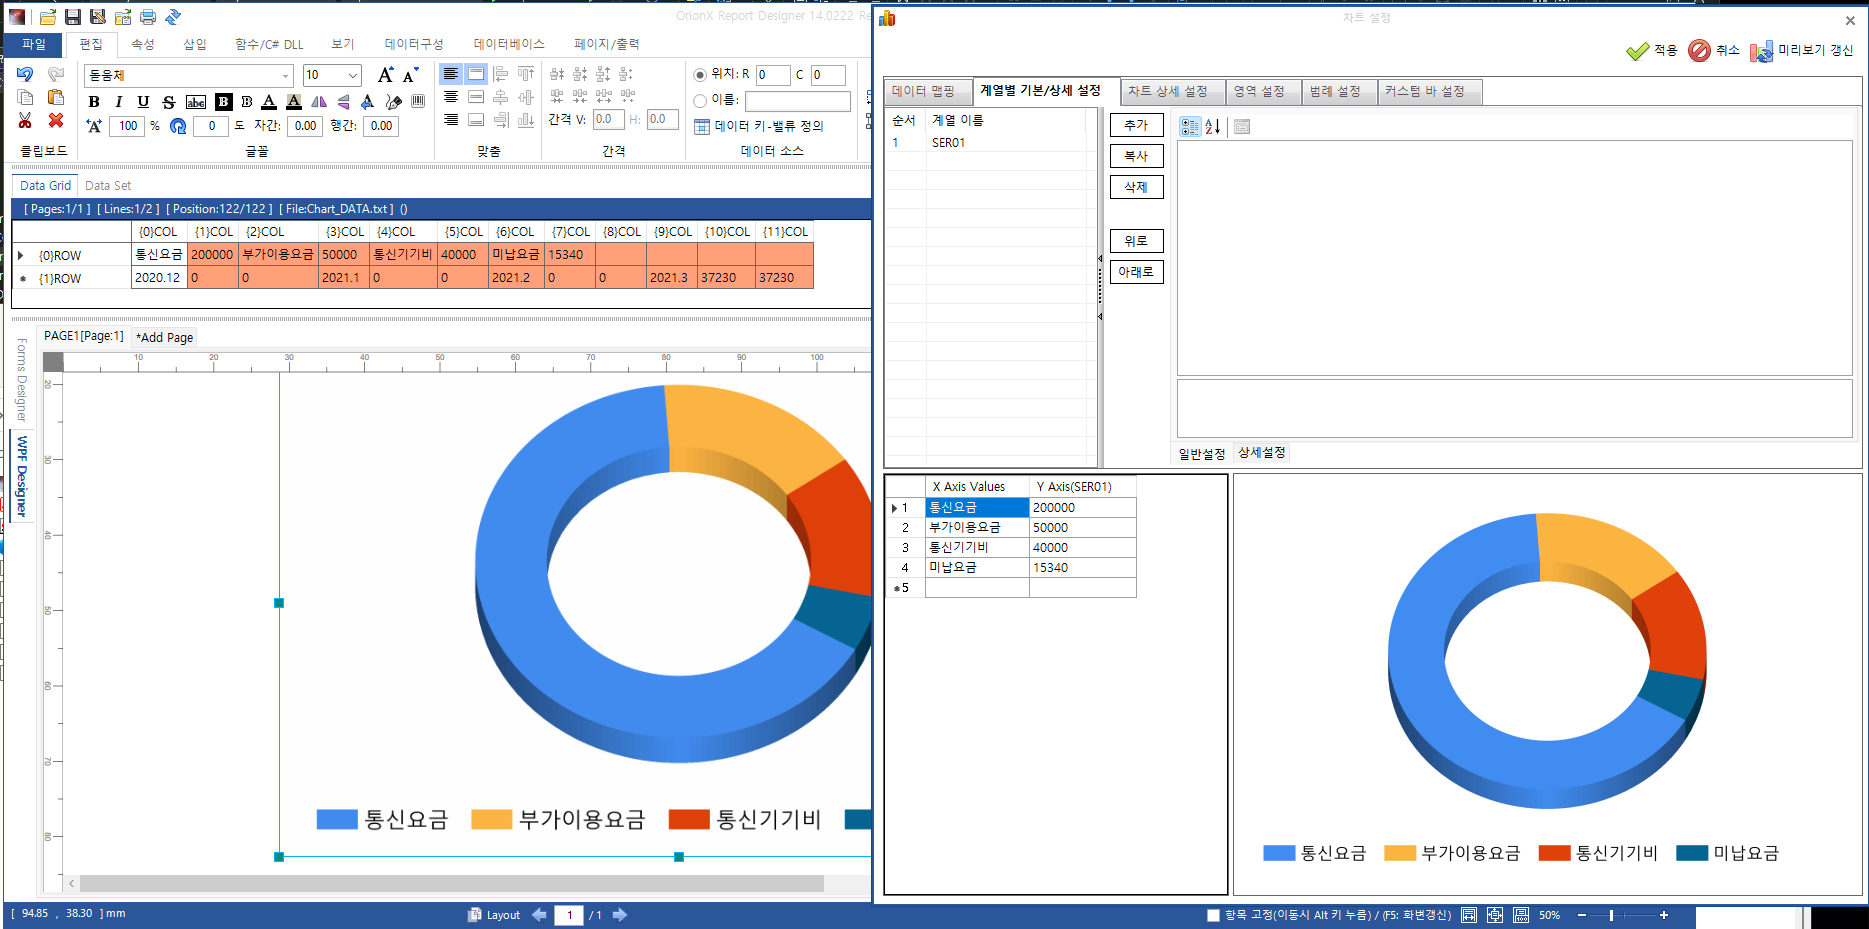
Chart Designer
Implementation of PDF & PostScript Charts
.NET Data Visualization library uses GDI+ for drawing chart’s components like X-Y axis lines, ellipses and label texts. So, I’ve implemented PDF and PostScript warappers to replace all GDI+ drawing methods that are used in chart drawing.
Performance Comparisons: PDF vs PostScript vs Image Charts
-
Creating 1,000 pages(A4, each page has 2 charts) outputs
PDF Chart (CMYK Color-Space) PostScript Chart Image Chart Creation Time 14 seconds 10 seconds 35 minutes File Size 7,362 kb 2,641 kb 430 mb -
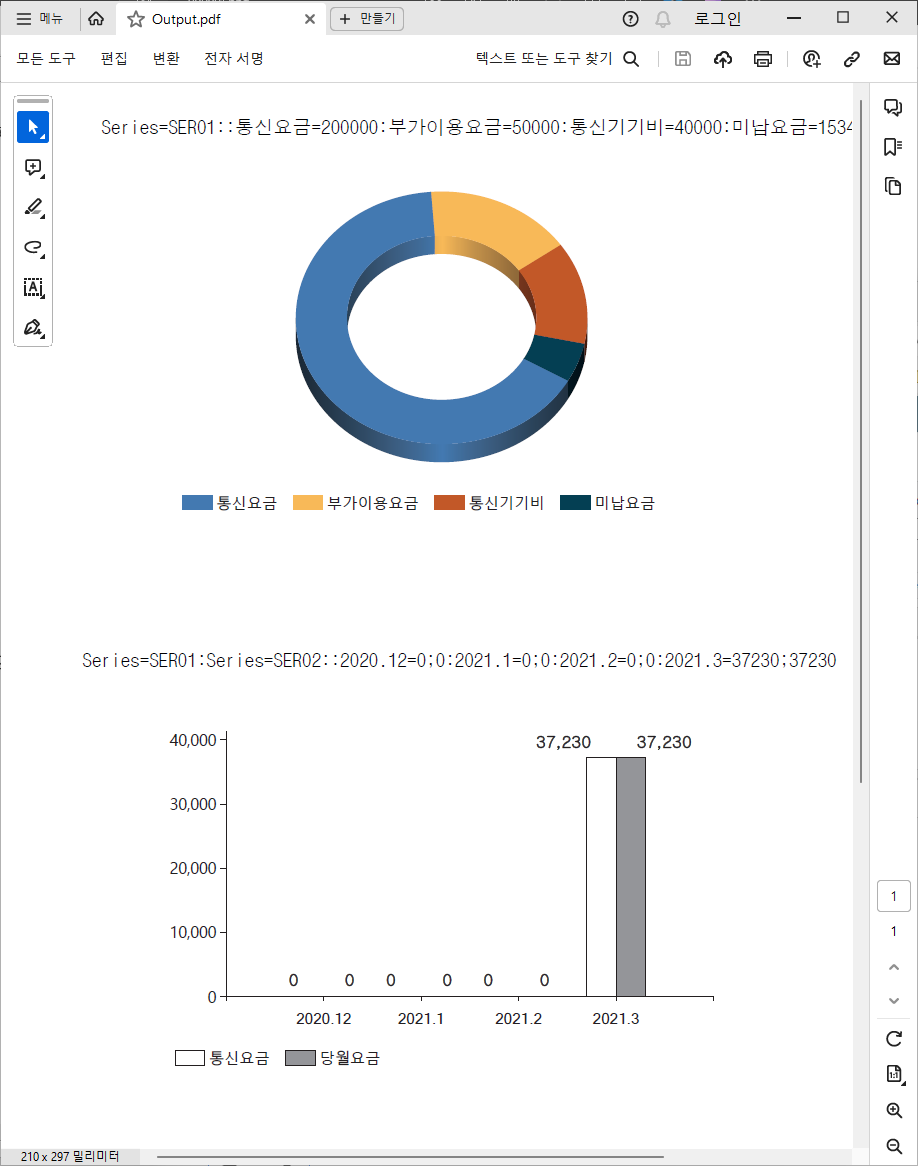
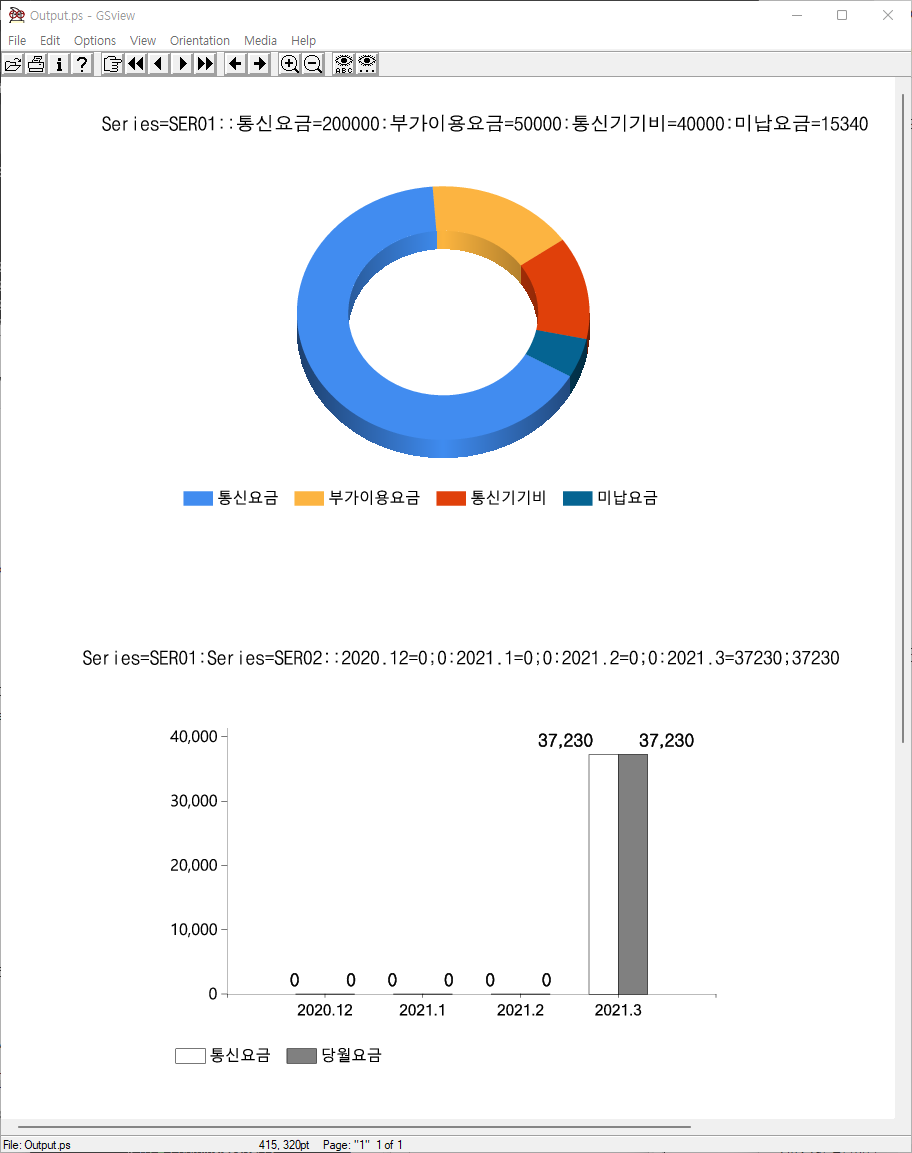
PDF Chart Sample - CMYK Color-Space
-
-
Image Chart Sample - 600x600 dpi in PNG format
Entry Points to Create PDF, PostScript Charts
-
SavePDF(), SavePS() methods in ChartWinControls.cs are the entry points for PDF, PostScript charts creation. And, these methods initialize the rendering information of PDF and PostScript.
-
SavePDF() Method
// -ChartPDF public void SavePDF(string lsPdfFile, System.Windows.Point chartLocation, PdfGraphicsInfo.EnumColorSpace lColorSpace, OrionX2.OrionFont.FontManagerConfig fontMgr, bool lbUseKValueCMYKEqual) { using (FileStream lfsPdf = new FileStream(lsPdfFile, FileMode.Create, FileAccess.ReadWrite, FileShare.ReadWrite)) { SavePDF(lfsPdf, chartLocation, lColorSpace, fontMgr, lbUseKValueCMYKEqual); lfsPdf.Close(); } } public void SavePDF(Stream lStrm, System.Windows.Point chartLocation, PdfGraphicsInfo.EnumColorSpace colorSpace, OrionX2.OrionFont.FontManagerConfig fontMgr, bool lbUseKValueCMYKEqual) { try { iTextSharp.text.FontFactory.RegisterDirectory(@"C:\Windows\Fonts"); iTextSharp.text.Rectangle pdfPageSize = new iTextSharp.text.Rectangle(0, 0, (float)OrionX2.ConfigInfo.UCNV.GetPointFromPixel(this.Width, renderingDpiX), (float)OrionX2.ConfigInfo.UCNV.GetPointFromPixel(this.Height, renderingDpiY), 0); using (iTextSharp.text.Document pdfDoc = new iTextSharp.text.Document(pdfPageSize)) { iTextSharp.text.pdf.PdfWriter pdfWrt = iTextSharp.text.pdf.PdfWriter.GetInstance(pdfDoc, lStrm); pdfDoc.Open(); pdfDoc.NewPage(); SavePDF(chartLocation, pdfDoc, pdfWrt, colorSpace, fontMgr, lbUseKValueCMYKEqual); pdfDoc.Close(); } } finally { } } public void SavePDF(System.Windows.Point chartLocation, iTextSharp.text.Document pdfDoc, iTextSharp.text.pdf.PdfWriter pdfWrt, PdfGraphicsInfo.EnumColorSpace colorSpace, OrionX2.OrionFont.FontManagerConfig fontMgr, bool lbUseKValueCMYKEqual) { PdfGraphicsInfo lPdfInfo = new PdfGraphicsInfo(fontMgr, new System.Windows.Rect(chartLocation.X, chartLocation.Y, this.Width, this.Height), RenderingDpiX, RenderingDpiY, lbUseKValueCMYKEqual); PSGraphicsInfo lPSInfo = new PSGraphicsInfo(null, null, fontMgr, new System.Windows.Rect(chartLocation.X, chartLocation.Y, this.Width, this.Height), RenderingDpiX, RenderingDpiY); try { lPdfInfo.cPdfDoc = pdfDoc; lPdfInfo.cPdfWrt = pdfWrt; lPdfInfo.ceColorSpace = colorSpace; lPdfInfo.DpiX = RenderingDpiX; lPdfInfo.DpiY = RenderingDpiY; SavePDF(lPdfInfo); } finally { } } public void SavePDF(PdfGraphicsInfo lPdfInfo) { this.chartPicture.isSavingAsImage = true; this.chartPicture.GetPDF(lPdfInfo); this.chartPicture.isSavingAsImage = false; } // ChartPDF- -
SavePS() Method
  // -ChartPS

  public void SavePS(System.Windows.Point chartLocation, PdfGraphicsInfo.EnumColorSpace colorSpace, OrionX2.OrionFont.FontManagerConfig fontMgr, Dictionary<string, PSFontData> ldctPSFonts, Stream lStrmHeader, Stream lStrmBody)
  {
      PSGraphicsInfo lPSInfo = new PSGraphicsInfo(lStrmHeader, lStrmBody, fontMgr,
          new System.Windows.Rect(chartLocation.X, chartLocation.Y, this.Width, this.Height), RenderingDpiX, RenderingDpiY);
      PdfGraphicsInfo lPdfInfo = new PdfGraphicsInfo(fontMgr, new System.Windows.Rect(chartLocation.X, chartLocation.Y, this.Width, this.Height),
          RenderingDpiX, RenderingDpiY, true);//lbUseKValueCMYKEqual);
      lPSInfo.cdctFontData = ldctPSFonts;
      try
      {
          lPSInfo.ceColorSpace = colorSpace;
          lPSInfo.DpiX = RenderingDpiX;
          lPSInfo.DpiY = RenderingDpiY;

          SavePS(lPSInfo);
      }
      finally
      {

      }
  }

  public void SavePS(PSGraphicsInfo lPSInfo)
  {
      this.chartPicture.isSavingAsImage = true;
      this.chartPicture.GetPS(lPSInfo);
      this.chartPicture.isSavingAsImage = false;
  }
  // ChartPS-
GDI+, PDF, PostScript Rendering Code
-
RenderGDI Code
- _graphics is GDI+ System.Drawing.Graphics object and it calls GDI+ DrawLine() methods.
... public void DrawLine( Pen pen, PointF pt1, PointF pt2 ) { _graphics.DrawLine(pen.ToGdiPen(), pt1, pt2); } ... -
RenderingGraphicsPDF Code
- this.cPdfCnts is iTextSharp’s PdfContentsBytes object and it draws a line on PDF page.
... public void DrawLine( Pen pen, PointF pt1px, PointF pt2px ) { if (pen.Color.IsEmpty || pen.Color.A == 0) return; float x1Pt = (float)UCNV.GetPointFromPixel(pt1px.X, this.DpiX); float y1Pt = (float)(this.ChartHeightPt - UCNV.GetPointFromPixel(pt1px.Y, this.DpiY)); float x2Pt = (float)UCNV.GetPointFromPixel(pt2px.X, this.DpiX); float y2Pt = (float)(this.ChartHeightPt - UCNV.GetPointFromPixel(pt2px.Y, this.DpiY)); this.cPdfCnts.MoveTo(x1Pt, y1Pt); this.cPdfCnts.LineTo(x2Pt, y2Pt); pen.ToPdfPen(this); this.cPdfCnts.Stroke(); } ... -
PSGraphicsInfo Code
- PS_moveto()/PS_lineto() methods create PostScript commands to draw a line.
  ...
  internal static string csPSmoveto = "m";
  internal static string csPSlineto = "l";
  ...
  public void DrawLine(
      Pen pen,
      PointF pt1px,
      PointF pt2px
      )
  {
      if (pen.Color.IsEmpty || pen.Color.A == 0)
          return;
      float x1Pt = (float)UCNV.GetPointFromPixel(pt1px.X, this.DpiX);
      float y1Pt = (float)(this.ChartHeightPt - UCNV.GetPointFromPixel(pt1px.Y, this.DpiY));
      float x2Pt = (float)UCNV.GetPointFromPixel(pt2px.X, this.DpiX);
      float y2Pt = (float)(this.ChartHeightPt - UCNV.GetPointFromPixel(pt2px.Y, this.DpiY));
      this.PS_moveto(x1Pt, y1Pt);
      this.PS_lineto(x2Pt, y2Pt);
      pen.ToPSPen(this);
      this.PS_stroke();
  }
  ...
  internal void PS_moveto(float lfX, float lfY)
  {
      WriteTo_LF(String.Format("{0:0.###} {1:0.###} {2}", lfX, lfY, csPSmoveto));
  }
  internal void PS_lineto(float lfX, float lfY)
  {
      WriteTo_LF(String.Format("{0:0.###} {1:0.###} {2}", lfX, lfY, csPSlineto));
  }